
The Forensics of Prime Medicine: Deconstructing the Volume Anomalies and Corporate Plumbing of $PRME

In our previous forensic look at biotechnology market structures, we uncovered how institutional market makers used stealth corporate dilution loops and massive liquidity sweeps to permanently defend the multi-year macro floor on Recursion Pharmaceuticals ($RXRX) which you can read here: https://shorturl.at/EaNM1
Today, we are shifting our Volume Price Analysis (VPA) lens to a clinical-stage entity operating in a vastly more explosive, structurally fragile phase of its capital life cycle: Prime Medicine, Inc. (NASDAQ: PRME).
While $RXRX has already re-engineered its capital plumbing to secure a robust operating runway through 2028, Prime Medicine is walking a high-stakes corporate tightrope in real time. Founded on pioneer David R. Liu’s revolutionary “Prime Editing” gene-therapy architecture, $PRME features a chart where cutting-edge medical breakthroughs are directly clashing with urgent corporate funding cycles.
By applying Richard Wyckoff’s Third Law—The Law of Effort vs. Result—this deep dive will dissect the structural footprint of $PRME’s monthly, weekly, and daily tape, decode the hidden institutional anomalies keeping the price pinned, and establish a framework for managing risk in the unique world of biotech investing.
The Macro Structure: Deconstructing the Post-IPO Markdown
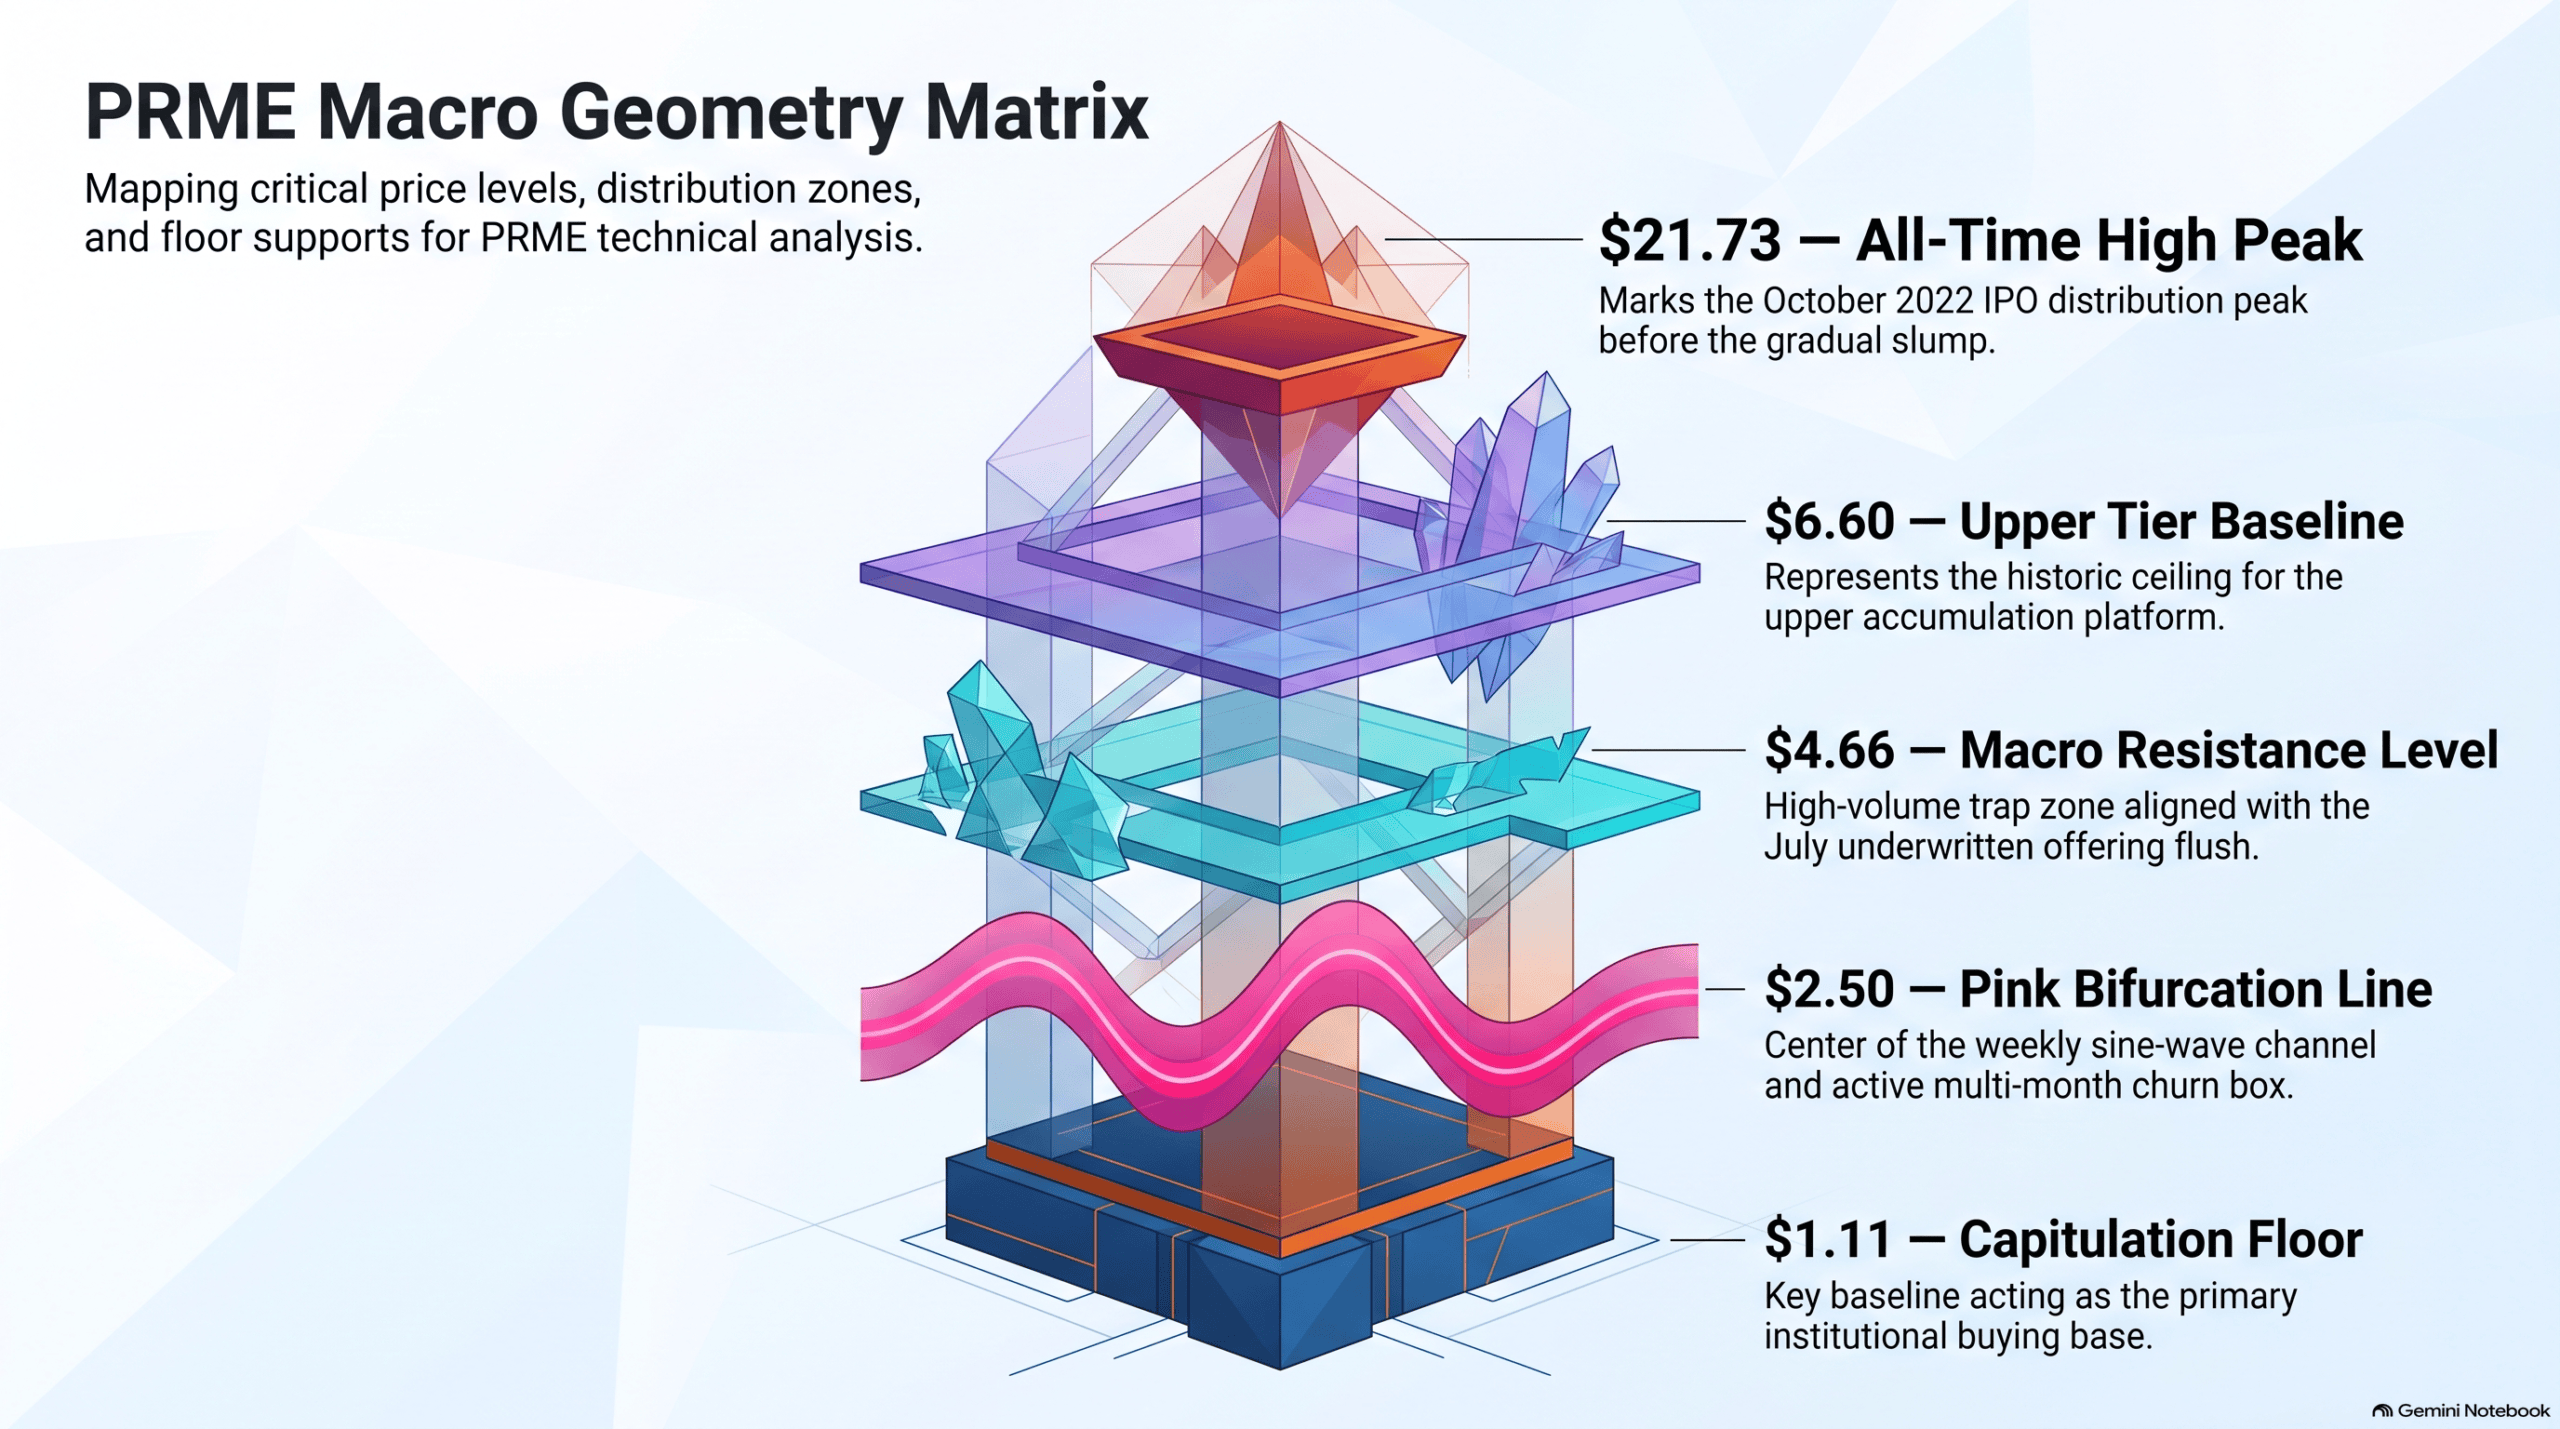
A glance at the monthly chart (see above) of $PRME reveals a pattern that has become the definitive hallmark of early-stage biotechnology listings. After its high-profile Initial Public Offering, the stock entered a classic IPO pump-and-dump cycle, topping out at an all-time high of $21.73 in October 2022.
Unlike equities that can suffer a single, catastrophic overnight crash, Prime Medicine’s markdown was engineered as a gradual distribution slump. However, institutional counterattacks punctuated this multi-year descent.
From April to July 2023, the tape staged a highly visible effort to reverse the macro downtrend. This reversal ultimately fizzled out, leaving a prominent bearish distribution shooting-star candle on the monthly view, followed by a narrow-bodied session on low volume. This clearly validated that organic market demand had completely dried up.
After this failure, the stock entered an extensive, two-tier accumulation phase from October 2023 through August 2024. This extended grinding phase carved out the structural support and resistance levels that dictate the chart’s geometry today.
The $1.11 Capitulation Floor vs. The July Volume Anomaly
The upper boundary of this historic base initially sat at $4.66, but an earnings-induced liquidation violently breached this floor to the downside. The stock entered a final capitulation flush, ultimately collapsing to an all-time low of $1.11.
It is at this exact low where the true power of Volume Price Analysis manifests for traders:
The Buying Absorption Floor
At the $1.11 absolute low, the May 2025 monthly candle printed a compressed, narrow price spread on expanding, volume. According to Wyckoff’s Third Law, this represents complete disharmony between Effort and Result.
If this volume represented unhindered public dumping, the price spread would have expanded into a much wider red waterfall candle. Instead, the narrow spread shows institutional “smart money” stepped directly into the sell-off’s path, catching the falling knife and absorbing the float to establish a clear accumulation baseline. This sentiment shift was confirmed shortly after by a powerful, high-volume bullish engulfing candle in June 2025.
NOTE: On the up-to-date monthly chart, this volume doesn’t seem particularly significant, but as you recall from the RXRX post, volume must always be evaluated relative to its immediate historical context.
The July 2025 Anomaly: Driving on an Icy Hill
While the June candle signalled clear trend validation, the July monthly candle represents the absolute forensic centre of this chart.
In July, the tape printed more than twice the trading volume of June yet achieved only a minimal increase in absolute net price size. Furthermore, the session left behind a an upper wick candle, completely reversing the moment it ticked into the $4.66 macro resistance baseline.

This is a textbook VPA anomaly: huge volume drove the price straight into a structural barrier, producing little progress. To understand why, we must examine the company’s financing structure.
Interrogating the Plumbing: The $125M Public Float Infusion
Most chart readers looking at the July upper wick would assume retail traders simply took profits at historical resistance. However, the corporate archives unmask a far more calculating institutional reality.
The company officially priced a massive, dilutive underwritten public offering of 38,000,000 shares of Class A common stock at a fixed price of $3.30 per share, successfully raising $125.4 million in gross corporate capital.
This capital plumbing mechanism perfectly explains the July chart anomaly. The company intentionally used the technical strength of the June breakout to flood the open market with a massive wall of newly minted equity supply right at the $4.66 resistance barrier. Market makers spent the entire month churning these 38 million fresh shares through the float. This systematic distribution capped the price progress, trapped eager breakout buyers, and generated the heavy upper wick.
The Pink Line Midpoint Bifurcation
This sequence of high-volume interventions has created a structural bifurcation in the macro $1.11 to $4.66 price range. By plotting a minor consolidation axis (the pink midpoint line on the chart) at $2.50, we can see exactly where market makers have boxed the asset.
The Weekly and Daily Micro Tape: A Rhythmic Institutional Trap

When we drill down from the macro monthly picture into the shorter timeframes, the structural genius of this accumulation layout becomes obvious.
The Weekly “Sine Wave” Harmony
On the weekly chart, $PRME isn’t moving randomly. It has spent months carving out a beautiful, rhythmic “sine wave” price flow. The price is oscillating between the structural floor of the pink bifurcation line at $2.50 and the rigid ceiling of macro resistance at $4.66. Each swing up and down is accompanied by highly consistent, programmatic volume blocks, proving that market makers are systematically keeping the price boxed to digest supply.

The Daily Micro-Trap Timeline (October 2026)
While the weekly chart establishes the rhythmic sine wave, the daily chart reveals how market makers weaponise clinical news headlines to execute tactical liquidity traps inside the box:
- Monday: The stock was languishing in a structural slump, pinned safely below its blue 200-day moving average.
- Tuesday: The tape gapped up over the 200 MA on heavy, expanding volume, forming a doji candle, an anomaly. This surge was triggered by a profound, fundamental transformation: Prime Medicine has officially transitioned from a speculative platform into an active, clinical-stage biotechnology firm. Prime announced that it successfully dosed the first human patient with its Prime Editor (PM577a) in a global Phase trial for Wilson Disease. This is wonderful, life-changing science that we all hope and pray succeeds for the sake of patients suffering from this condition, but market makers treat it purely as a liquidity tool.
- Wednesday: Momentum carried into another vertical surge, triggering our Quantum Volatility Indicator as price spiked to an intraday peak of $4.02 on high volume.
- Thursday & Friday: The market strictly respected the quantum volatility rule. Price retraced directly into Wednesday’s candle range, falling back to 3.52, with both candles finding structural support at the 200 MA.
Retail traders rushed into the stock on Wednesday due to FOMO, buying the peak. Market makers used that flood of public buying to cap the stock well below the $4.66 macro resistance ceiling, creating the perfect window to prepare for the company’s next critical corporate financing round or share shelf deployment.
What is the “Smart Money” Doing?
As I always mention in my live streams and YouTube videos, VPA anomalies are key to spotting insider and coordinated institutional operations. How? Because they always ask the fundamental question: are we seeing harmony or disharmony? The VPA anomaly signals what isn’t happening in price action and volume, acting as a massive flashing red flag. Moreover, these structural signals are especially powerful when they manifest at key macro and psychological levels.
An anomaly automatically raises another set of critical questions for us as tape readers: why is the price compressed despite this massive volume effort, and who benefits? The answer almost always traces back to a highly tactical liquidity sweep, or it tells us that insiders simply aren’t ready to start the campaign higher just yet. To facilitate this, market-maker churn continues behind the scenes, and it becomes clearly visible as rhythmic consolidation within the broader accumulation phase.
The VPA anomaly is a powerful structural signal that can help traders and investors avoid market makers’ traps, such as chasing public news spikes out of pure FOMO. What makes today’s trading environment so interesting is that we can now gain secondary insight into what’s happening behind the curtain via the Dark Pools.
For instance, this past week, while the public “lit” exchanges printed a volatile intraday red retrace on $PRME down to $3.55—panicking late retail buyers into dumping their positions—alternative data platforms picked up the exact institutional footprint validating our VPA baseline. A single, massive block trade worth $4.2 million crossed quietly off-exchange in the Dark Pool exactly at the $3.60 support level.
This hidden data completely validates the Wyckoffian geometry of the chart. It proves that while retail emotionally chased the peak on Wednesday and panic-sold the dip on Thursday, a large institutional player used that public liquidity to quietly absorb a massive block of shares at baseline support. This “Signature Print” heavily anchors the current micro-consolidation box as a heavily defended institutional floor.
However, it is vital to remember that not having access to these expensive alternative data feeds never hinders successful trading. While tracking Dark Pool prints is highly useful, VPA remains the universal, mandatory edge.
An institution can hide its pre-trade intent from the public order book, but it can never escape the public volume bar. The moment those private transactions execute, regulations force them to print to the consolidated tape, revealing themselves on your chart as a clear high-effort, low-result anomaly. The geometry of the price cycle will always reveal the insider footprint if you are patient enough to let the tape decipher the narrative.
In summary, the institutional footprints in the dark pools can never be truly hidden because they must eventually filter through to the volume bars and candle spreads on the public exchange.

What is the Dark Pool in Simple Terms?
If you’re unfamiliar with the Dark Pool, here is a brief explanation. When you buy or sell a stock on a regular app, your order goes onto the public, or “lit”, exchange where everyone can see it. However, giant institutions (like hedge funds and investment banks) cannot trade millions of dollars of stock on public exchanges without instantly driving the price up or down.
To solve this, they use Dark Pools—private, off-exchange venues where massive blocks of stock can be crossed quietly under the radar. The public cannot see these orders executing in real time on a standard chart, but the VPA anomaly signals it.
The Core Mandate: Crucial Lessons for Trading Biotech Equities
For traders moving from analysing $RXRX to building a tactical playbook for $PRME, this setup is a vital case study in the biotech sector’s unique structural risks. When investing in these pre-revenue entities, you must manage three distinct forces:
The Urgent Cash Runway Clock
As we established in our $RXRX analysis, chart lines show the boundaries, but the balance sheet shows when the next volatility explosion will occur.
According to Prime Medicine’s latest regulatory filings, the company carries $108.8 million in cash and cash equivalents. Because their complex research and development operations incur a steep net loss of roughly $42.1 million per quarter, their total operational runway only extends “into early 2027.”
This creates a highly compressed funding window. Prime is burning through cash at an annualised rate that represents a significant percentage of its entire market capitalisation. Unlike $RXRX, which bought itself operational serenity through 2028 via its At-The-Market funding facility, Prime Medicine is constantly reliant on the immediate threat of secondary offerings.
We must therefore treat the current $2.50 to $4.66 consolidation box as an active liquidity compilation phase. Market makers are intentionally keeping the price contained, allowing institutions to build large stakes before the company is forced to execute its next corporate financing round.
Float Density and Breakout Velocity
Our comparative analysis also provides a critical lesson in float mechanics:
- The Thick Float ($RXRX): Through its Exscientia merger and aggressive ATM issuance, Recursion expanded its share float to over 532 million shares outstanding. A float this dense acts like a heavy flywheel; it requires massive, sustained daily volume churn to clear out overhead supply and move the price out of its box.
- The Thin Float ($PRME): Despite its recent 38-million-share public offering, Prime Medicine maintains a highly compressed capital structure of roughly 138 million shares outstanding. Because the float is significantly “thinner,” any sudden influx of capital or short-covering demand can trigger immediate, violent vertical price expansion.
The 33% Short Interest Squeeze Tinderbox
Finviz data reveals a massive structural x-factor: PRME’s short interest has ballooned to nearly 33% of its entire publicly tradeable float.
Because the total share float is so incredibly thin (138M shares), this short interest is dangerously crowded. Short sellers are betting heavily that the company will be forced to dilute shareholders again before 2027 to stay alive.
The Tactical Verdict
The weekly sine wave and the daily tape on $PRME are a textbook visualisation of an asset under heavy institutional accumulation. The VPA shows the buying support at the floor is authentic, while the Dark Pool print at $3.60 confirms smart money is aggressively defending this level behind the scenes.
Moving forward, tactical market participants must remain extremely patient within the weekly consolidation channel while keeping a close eye on the daily chart. Market makers are keeping the price pinned to shake out retail option premiums and complete block hand-offs.
However, because the float is so thin and over a third of it is short, a decisive weekly and monthly breakout close cleanly above the $4.66 resistance ceiling will trigger an automatic, systemic short squeeze. The moment those trapped shorts are forced to cover alongside institutional accumulation, the tape will clear for a violent vertical extension toward the upper tier accumulation platform that extends to $6.60

Update – I prepared the above analysis before the close of trading on Friday, and as the chart shows, last week’s price range and volume confirm patience is now key.
By Anna Coulling – creator of volume price analysis

Ready to Master Stock Trading with Volume Price Analysis?
Join The Complete Stock Trading & Investing Program by Anna Coulling and unlock professional-level insights. Learn to spot institutional accumulation, avoid traps, and build consistent strategies using VPA. Lifetime access, Quantum indicators, and real-market examples—transform your investing today!
By Anna Coulling – creator of volume price analysis

Ready to Master Forex Trading with Volume Price Analysis?
Join The Complete Forex Trading Program by Anna Coulling and unlock professional-level insights. Learn relational strength, spot momentum shifts, and build consistent strategies using VPA. Lifetime access, Quantum indicators, and real-market examples—transform your forex trading today!

Leave a Reply